


Debt, Deficits & Growth
An American Tale

Déjà vu All Over Again
Over the past half-century, U.S. deficits and the mounting national debt have been perennial topics of economic debate and political posturing. Each era has brought its own warnings about fiscal responsibility, economic collapse, or unsustainable borrowing, often accompanied by policy proposals that are all over the map. Despite constant alarm bells, the U.S. economy is sitting at the highest government debt relative to GDP than ever before. The number, and the narratives surrounding the, are fairly straightforward. Conceptually, it’s a simple problem. Don’t spend more than you earn. However, when you’re talking about economics on the macro scale, things are considerably more complicated.
In the 1970s, concerns about deficits often centered on inflation and the erosion of the U.S. dollar's (USD) value. Following the breakdown of the Bretton Woods system in 1971, which broke the link between the USD and gold, the OPEC oil embargo and stagflation forced policymakers to confront deficits in military spending, along with rising inflation. During the 1980s, the Reagan administration's combination of tax cuts and defense spending drove deficits sharply higher, sparking fears that high real interest rates would depress private investment and over-reliance on foreign creditors. These concerns continued into the 1990s, though by the decade’s end, a rare budget surplus emerged, fueled by robust economic growth and rare fiscal discipline. Yet, the surplus was fleeting. Once the Tech Bubble burst, deficits became the norm again.
Since the turn of the century, deficits have been driven by new dynamics: the wars in Afghanistan, and Iraq, the 2008 financial crisis, and more recently, pandemic-related spending. Federal debt as a share of GDP surpassed 100% in the wake of COVID-19, prompting comparisons to wartime borrowing during the 1940s. What separates today's challenges is the scale and persistence of the fiscal imbalance. With entitlement programs like Social Security and Medicare under strain from demographic shifts and interest payments on debt rising amid higher rates, today's warnings feel more urgent. While the U.S. continues to wield considerable economic and financial power, the debate is no longer just about deficits and debt in isolation but their implications for growth, equity, and long-term global competitiveness.
The Two Santa Clauses
The political reality is that running deficits benefits both the Republican and Democratics politically. The "Two Santa Clauses" theory, introduced by Jude Wanniski in 1976 Jude Wanniski - Wikipedia, is a political strategy that has profoundly influenced U.S. fiscal policy and party dynamics. Wanniski's idea was straightforward: if Democrats acted as "Santa Claus" by promoting social spending, Republicans could counter by becoming a second Santa Claus, emphasizing tax cuts. This strategy allowed Republicans to appeal to voters without directly opposing popular spending programs, while simultaneously creating long-term fiscal pressures that would challenge Democratic priorities. The result is chronic deficit spending, with neither side willing to admit responsibility, and Americans growing increasingly pissed off about it. Sadly, very few understand the game that’s being played.
Under Ronald Reagan, this theory found practical application. Massive tax cuts, paired with significant increases in defense spending, caused the federal deficit to balloon. By the end of Reagan's presidency, the national debt had more than tripled, forcing Democrats into a politically precarious position. When Bill Clinton took office, he faced pressure to address the deficit through tax increases and spending cuts, effectively playing the role of the "anti-Santa Claus" by passing tax hikes on higher earning Americans. Contentious budget negotiations with Republicans, including government shutdowns, eventually led to some substantial spending cuts in the mid-90s. Combined with extraordinary economic growth driven by the Tech Bubble, it created the largest surpluses
The theory also highlights how fiscal policies have been wielded as political tools rather than strictly economic solutions. Republicans often downplay deficits during their administrations while emphasizing them under Democratic leadership, perpetuating the narrative that Democrats spend like drunken sailors, and Republicans are forced to act as fiscal hawks. This cyclical manipulation of fiscal policy underpins much of the partisanship in Washington and remains a central theme in the broader debate over government spending and economic priorities. Few things have become as contentious as the perennial Congressional fights over raising the budget limit.
The General Framework
As I previously stated, most people understand government deficits in the simple terms of money in, money out. If we spend more than we take in on tax receipts, we run a deficit, and that is bad. The easy solution is to just cut back on spending. But this is not a household budget we’re talking about. Unlike a person’s spending, Government spending influences the economy as a whole.
Government expenditures provide income for individuals and companies, some of which will then be used to pay taxes. It positively affects economic growth. This isn’t to say that more spending is always better, it’s just a basic accounting relationship. If I spend more money as an individual, it doesn’t created extra income. It’s a one-way negative cash flow for me. But if the government is spending money, it’s putting more money into the economy, which becomes a part of economic output, thereby increasing GDP.
The problem arises when the government becomes too large a part of the economy, which creates inefficiency and slows economic growth. It’s not easy to know what the optimal size of government is, although both parties believe that they do. Republicans typically think it should be smaller, while Democrats lean toward a larger government. This viewpoint is quite simplistic, since how tax money is spent affects the economy with wide variability. Government spending on defense, infrastructure, and social welfare all differ in how the money flows through the economy. Spending priorities also have different effects on economic incentives, which affect people’s actions.
Chart 1 below shows how the federal government has gradually increased its share of U.S. GDP over the last century (red line). Going back to 1930, the federal government only represented about 3% of GDP. This past year, that number had ballooned to around 22%. However, that present level is still somewhat inflated by excess spending that took place around Covid.
The blue line in Chart 1 shows the amount of taxes the federal government takes in every year as a percentage of GDP. The difference between the red and blue lines for each year is the U.S. federal deficit as a percentage of GDP. Since 1930, there have been four periods in which expenditures were larger than tax receipts for several years at a time.
The first was the 1930s, in the wake of the Great Depression. For obvious reasons, government spending tripled from 3% to 10%, as the country dealt with 25% unemployment, widespread homelessness (Hoovervilles), and an economy that had been shaken to the core. This situation held up into WWII, where massive defense spending eventually pushed the U.S. government to over 40% of GDP in 1944-45.
Chart 1: U.S. Federal Spending (red) and Tax Receipts (blue) as a Percentage of GDP

In the 20 years that followed WWII, spending returned to about 17% of GDP, and deficits were largely kept under control. Chart 2 below shows Total U.S. Federal Government Debt as a percentage of GDP. Even though there weren’t many budget surpluses, consistent strong economic over growth allowed for the Total Debt to GDP ratio to go from 120% to around 30% in 1975.
Chart 2: U.S. Total Federal Debt as Percentage of GDP

Since 1981, there’s mostly been a persistent move higher in debt to GDP. The oil shock of the ‘70s automatically pushed inflation higher, because it’s a major component in all products. The Federal Reserve at the time chose not to tighten monetary policy to fight this commodity driven inflation, because they felt such policy would be too restrictive for the economy as a whole. The result was the “stagflation” that is often associated with the 1970s (i.e. choppy economic growth mixed with high inflation). Inflation was eventually brought under control by newly appointed Fed Chairman Paul Volker in the early ‘80s when he raised rates to double digit levels and thrust the economy into a recession.
Supply-Side Experiment
From that point, there were some interesting developments. Chart 2 shows an immediate upward trend in debt to GDP moved it from 30% in 1981 to 65% by 1995. What’s odd about this is that the ‘80s were notable for the election of Ronald Reagan, and the “Supply Side Revolution”. In effect, “Reaganomics” consisted of lowering marginal tax rates (somewhat offset by closing tax loopholes), decreasing regulation, freer trade, and shrinking the size of government. Mostly, it was meant to be a move toward a freer market economy. That’s not exactly what happened though.
Chart 3 shows U.S. Government Spending (blue) and Tax Receipts (red) both as a percentage of GDP. It’s easy to see there was no shrinking of government during the 1980s. Deficits ran about 5% of GDP through the early and mid-80s. Although economic growth was fairly high, the question arises whether or not the high deficits were helping boost GDP. As I stated before, growth and deficits can be linked, but the nature of that link can vary. Higher or lower deficits may have a positive or negative effect on growth respectively. At the same time, an economy going into a recession will have a negative effect on the deficit. As people lose jobs, and economic activity slows down, tax receipts will fall, necessarily raising the deficit. This latter effect can be seen in Chart 3 around every recession (shaded grey areas). Whenever the U.S. enters a recession, GDP growth (blue line) falls, and the deficit (red line) gets more negative.
Back to Back Economic Trauma
Skipping ahead to 2008, we can see these data around the Great Financial Crisis (GFC). GDP growth plunged to negative, and the Federal Budget Deficit skyrocketed. At the trough of the crisis, the U.S. budget deficit reached almost 10%. Beyond the normal fall in receipts, and automatic economic stabilizers, such as unemployment insurance, this crisis led to an unprecedented number of federal programs created to stabilize not just the U.S. economy, but the entire world.
While we avoided a 1930s style Great Depression, there was plenty of fallout in the aftermath of the GFC. Anger against bank bailouts, and the general feeling that “the little people” always get screwed was pervasive. A left wing populist movement called “Occupy Wall Street” became one of the largest protests of its kind probably since the 1960s Vietnam War protests. Similar events took place around the world in 2010-11.
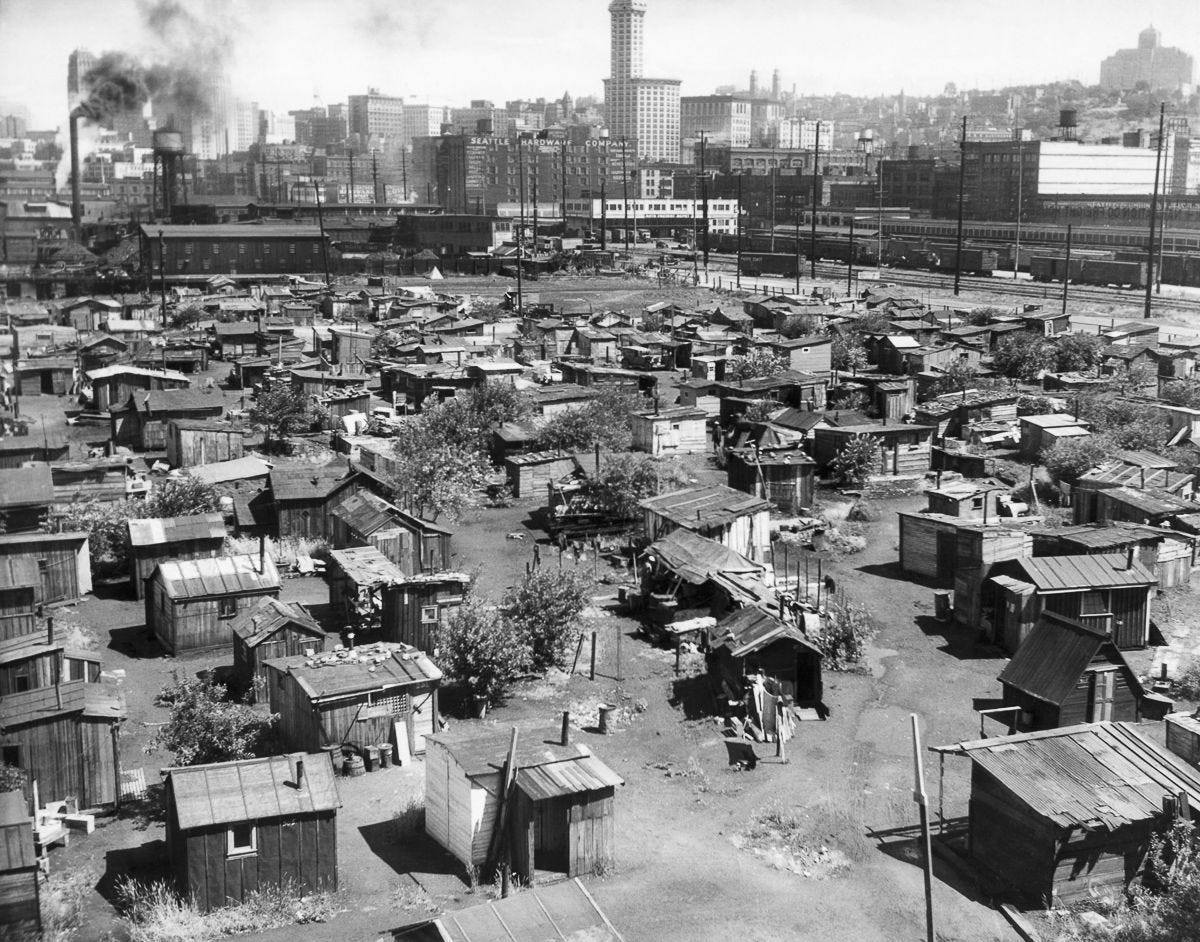
1930s - “Hoovervilles” – Shanty towns that popped up during the Great Depression.
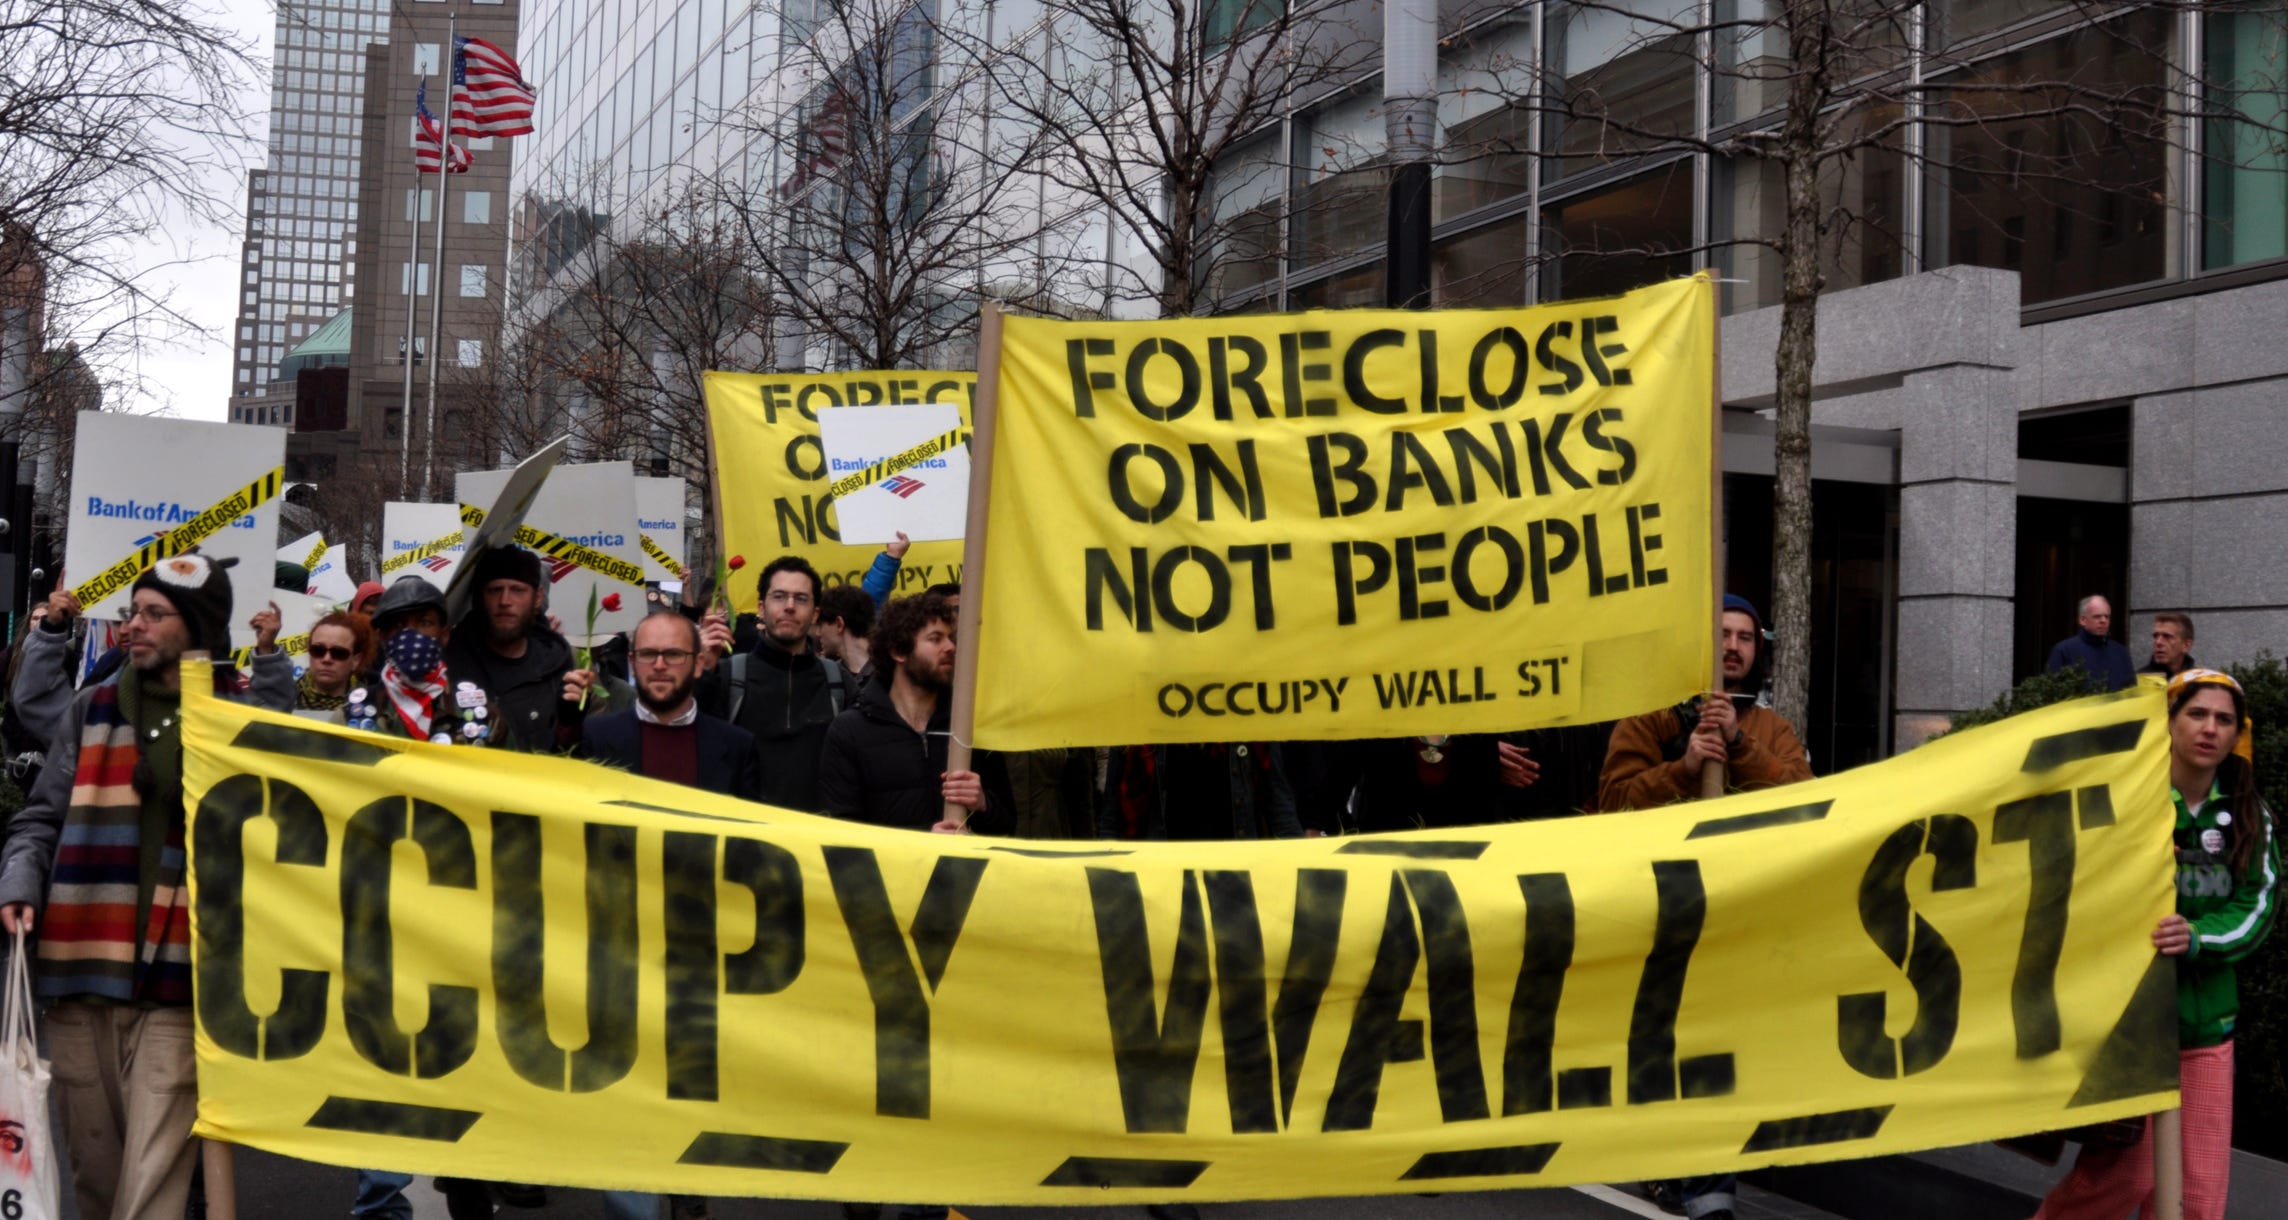
Protestors during the Great Financial Crisis - Occupy Wall Street - Wikipedia
Only 12 years after that, in 2020, the Covid pandemic hit worldwide, the economic fallout from which was even worse than the GFC. GDP growth dropped -7%, and the budget deficit exploded to 15% of GDP. Both the GFC and the Covid pandemic were events that without massive government intervention would have resulted in outcomes similar to the Great Depression.

Chinese preparing to disinfect Wuhan Railway Station during lockdown in 2020.
Of course, there are always differences of opinion as to how the government should best respond. Particularly in hindsight. But the idea of the government doing nothing is unacceptable. Some free-market types might think it is the best course of action, but the American people would never have allowed inaction in either of these circumstances. What that means is that these large budget deficits were going to occur regardless, causing the U.S. to build up a huge debt to GDP ratio that has now eclipsed the level from WWII. The GFC alone took our debt from 60% of GDP to over 100%, and Covid pushed it to over 120%.
Chart 3: U.S. Federal Budget Surplus/Deficit with Real GDP Growth

Which Way Forward
There are a host of arguments as to why deficits have been so persistent in the last 4 decades. But it’s important to note that during both the GFC and the Covid pandemic large budget deficits were probably unavoidable. I make this point because like so many other political issues in recent years, there is often little real argument and debate. Both sides primarily point fingers, because no party wants to take responsibility, and suffer the repercussions. Until we find a way to make our elected officials accountable, it’s difficult to see how the extraordinary economic problems we face today can be solved.
I’ve written several pieces detailing why there is so much economic angst in the U.S. today. Weak income growth for lower income Americans over the last few decades relative to wealthier classes. Manufacturing jobs sent overseas, and automation eating into the jobs that are left. A recent bout of high inflation following Covid that has hit working class Americans very hard. After the GFC and Covid economic crises, many were desperate for a change from business as usual. No matter what that change entailed. Polls say that the economy was the number 1 issue in this presidential election, and Republicans almost always get the upper hand in voters’ minds, despite the fact that historical economic data says otherwise. Whatever the case, with control of the presidency, and both houses of congress, it’s the Republican’s problem for now. With the extraordinary policy changes that are being discussed for early in the Trump administration, things could go extraordinarily well, or extraordinarily bad. Voters wanted to roll dice - and their bet has been placed.