
Stag Party

https://robertlovespi.net/2024/11/26/trump-apparently-skipped-out-on-econ-101/
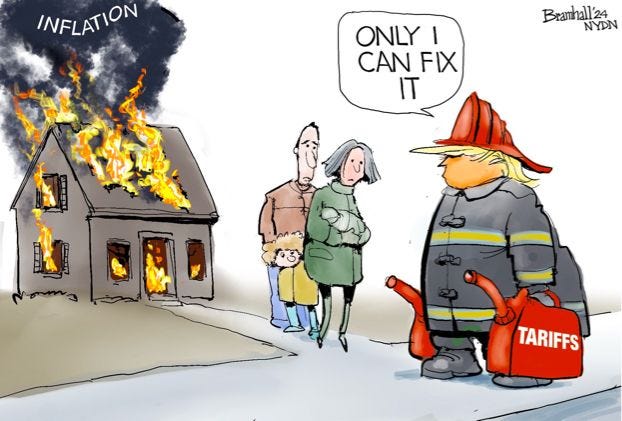
While the country has been increasingly jerked around over the last few months regarding the implementation of trade tariffs by Donald Trump, there has been an ongoing debate about whether or not tariffs would be inflationary. Fed Chairman Jerome Powell has expressed concern about this since implementation. In order to analyze how that may come about, here is a quick rundown of the different types of inflation recognized by economists.
Causes of Inflation
The roots of inflation are varied and complex. Among the primary causes are:
· Demand-Pull Inflation: This occurs when demand for goods and services outpaces supply, driving prices higher. Factors such as increased consumer spending, government expenditure, or investment can trigger demand-pull inflation.
· Cost-Push Inflation: Rising production costs—such as wages or raw materials—can lead businesses to raise prices to maintain profitability. External shocks, like oil price spikes, often contribute to cost-push inflation.
· Monetary Inflation: When central banks increase the supply of money, either by lowering interest rates or through quantitative easing, more money chases the same amount of goods, leading to inflation.
· Built-In Inflation: This stems from the wage-price spiral, where higher wages prompt businesses to raise prices, which in turn leads workers to demand even higher wages. The cycle is self-perpetuating, and can lead to rising long-term inflation expectations, which can lead to stagflation.
Stagflation
Stagflation is increasingly a worry for many economists and investors given the current environment. Defined as a prolonged period of elevated inflation, with weak economic growth, and higher than average unemployment, stagflation is a rare occurrence that is difficult to deal with once entrenched. Utilizing definitions of types of inflation given above, we can track how that plays out.
The primary experience of stagflation came about in the 1970s with several catalysts, and perpetuating factors. Coming into the 1970s, the U.S. was firmly embedded in the Vietnam War with substantial defense spending taking place, and a growing social spending (The Great Society) starting to create large fiscal deficits. This was the first time that had happened since the end of WWII, and it seemed to alarm many of our trading partners.
In the post-WWII monetary system, a new gold standard had been implemented called the Bretton Woods Gold Standard. Except – that it wasn’t a true gold standard - it was actually a U.S. Dollar standard with the USD pegged to a fixed price for gold ($35/oz). European countries, particularly France started to worry about the value of the USD when they started to accumulate large USD reserves in the 1960s. France secretly started to exchange their USDs for gold, and by end of 1966, France had exchanged their accumulated dollar reserves for over 3000 tons of gold.
By 1971, it became obvious that the if the U.S. were to stick with a $35/oz gold exchange rate, we would soon run out of gold. However, there was another way. The Federal Reserve could have raised interest rates, slowed the economy, and defended the gold peg, but there was no particular appetite for that. It would have led to a nasty recession. So, the path of least resistance was to unpeg the USD to gold, which is what President Nixon did. This was the event which launched what is sometimes called the “Age of Financialization”. That is, finance started to play a much bigger part in the economy at that point.
The most immediate effect was to allow monetary policy to become less tethered to the real economy. This made it much easier to finance any given size deficit the government might run. What it also did was allow for more policy flexibility in times of stress, and the 70s were a uniquely stressful time.
Charts 1 and 2 below allow us to see how stagflation in the 1970s developed. Chart 1 shows an overlay of U.S. Real GDP growth with CPI YoY. The two series have been smoothed with 12 quarter EMAs (3 years) to decrease the noise in the data. Using what’s called the “Sahm Stagflation Indicator” we have a > 3% threshold for inflation (red dotted line) combined with a < 2% critical level for GDP growth (blue dotted line). When these two conditions are both met, the indicator says we’re in a period of stagflation. As can be seen, the actual periods where both conditions apply are not common. They are also obscured by recessions (gray areas in the chart). Inflation tends to lag, so it will often stay elevated for a while after growth collapses. This means that these periods of stagflation are often transitory, but the persistence in certain periods tells the tale.
Chart 1: Real GDP and CPI with Critical Levels.

Chart 2: Sahm Stagflation Signal

Chart 2 shows the binary outcomes of the model over the last 80 years. The green areas denote times when the quarterly data is signaling stagflation, while the purple indicates when the 12 quarter EMA is giving the stagflation signal. One thing is certain from these charts. The 1970s and early 80s show stagflation plagued the period, and was about 2 to 3 times more prevalent than normal.
Creating the Backdrop
The early 1970s had two major separate events that came together to create a major supply-side shock via drastically higher crude oil prices. First, the U.S. - long the world’s dominant oil producer - reached peak oil production and then handed the title of top oil producer over to Saudi Arabia. While this was playing out, tensions in the Middle East were blowing out of control. The U.S. support for Israel against the Arabs in the Yom Kippur War led the “Arab League” to enact an oil embargo that caused crude oil prices to quadruple in a short period of time, creating a massive supply side shock.
Since energy underpins the cost structure of practically everything in the economy, this immediately raised the cost of everything (Cost-Push Inflation), causing significant stress among U.S. consumers. Rising prices would normally be offset by a tightening of monetary policy to stamp out the inflation, but that’s not what happened in the 1970s. Fed Chairman Arthur Burns followed the general consensus among economists at the time in believing that non-monetary events such as the oil price spike should be ignored, and that monetary policy should simply support growth.
In hindsight, it’s easy to see the mistake in that reasoning. Once the spike in oil prices took place, businesses had to raise prices to maintain profits, then workers had to demand higher wages to afford to live. Built-in inflation took hold (wage-price spiral), and a perpetual cycle of rising prices set in with higher unemployment, and slower growth. Ultimately, there were three steps in the development of 70’s stagflation: a supply-side shock in spiking oil prices; a central bank willing to monetize the higher oil prices by ignoring the inflation and focusing on supporting growth; and a change among people’s long-term inflation expectations, which helped perpetuate the built-in inflation (wage-price spiral). Worries that we may slip into another era of stagflation is driven by the parallels that many see between the current situation (high tariffs), and the 1970s.
History Rhymes
There is a different type of shock hitting the global economic system in 2025 vs. the 1970s. Donald Trump’s widely professed love for tariffs was mostly dismissed prior to the election and earlier in the year. But when “Liberation Day” came, and the Trump Administration announced draconian tariffs implemented globally under dubious rationales, investors quickly envisioned a giant whole opening in the global economy. Trump talked tough for a few weeks before drastically lowering most of the tariffs to 10% and offering various extensions over the ensuing months.
TACO (Trump Always Chickens Out) is the name given the phenomenon of Trump continually offering extensions on the implementation of tariffs since April 1. Due to this, the market seems to have priced in an outcome where there will be little fallout from Trump’s tariffs. Certainly, the hit will be less than previously feared, but it is not at all clear that the effects will be benign.
It’s not helpful to get bogged down in the specifics right now. Trump is changing course constantly, with some countries getting slammed with higher tariffs, while others get to skate for a while. The general consensus among experts now seems to be that U.S. trade tariffs will wind up averaging somewhere between 15-20% when the dust all clears. It has been noted a great deal that tariffs have yet to have a substantial effect on inflation, but this is easily explained. The key word is YET.
When it first began to be understood that Trump was taking a much more aggressive approach on tariffs than expected, many importers frontloaded inventory to accumulate what inventory they could before the tariffs took effect. This helped businesses weather of the early costs of the tariffs to keep consumer prices down. Since then, businesses in general have been eating some of the tariffs as they slowly start to raise prices. We’re still early in the process, and the full effects of the current anticipated tariff levels have barely begun to hit. Even though the worst-case scenario seems to be off the table for now, this will create a price level rise that could start a self-perpetuating cycle.
Fed Chairman Jerome Powell has been adamant in recent months that the potential for tariffs setting off an inflationary cycle warranted waiting to see how the economy would react. Donald Trump has used his bully pulpit in the usual manner to coerce Powell into rate cuts. That is, he made up a nickname (“Too Late” Powell”) and has repeatedly floated the notion that he would have Powell fired. The law seems to be pretty clear that Trump cannot fire Powell for purely political reasons. This means that he must have some reasonable “cause”, and as of now, no one believes Trump has any strong enough reason to meet that standard.
The danger here should be clear. While the tariffs may not be as detrimental at expected levels as the oil shocks of the 70’s, they are still likely to act similarly as a supply-side shock. Many of the products that are made here in the U.S. require parts that must be made overseas (e.g. car parts and microchips). As these parts get more expensive, U.S. products will as well. In many cases, there is no way to produce these parts cheaply enough in the U.S. to make production here economically viable. The most common example used lately has been how much it would cost to completely produce iPhones in the U.S. Estimates vary, but some experts believe it would cost as much as $3500 vs. around $1000 now. This would be outside of a lot of consumer’s price range. Many other products would see similar sticker shock.
This is only one example, but the point should be clear. Labor costs here in the U.S. are prohibitive to manufacture many of the products that our consumers desire. Part of Trump’s stated purpose with these tariffs is to force foreign companies to produce more products here, and/or to create an American Renaissance in manufacturing. The problem is that for this to happen on a wide scale, these new factories would need to be heavily automated. In other words, the amount of jobs created by any uptick in U.S. manufacturing is likely to fall short of what many believe. Certainly, it would create some higher-level tech-oriented jobs, but the nostalgic wish for the American factory worker dominating the U.S. economy is not likely to make a comeback. The bottom line is that U.S. workers are too expensive for labor intensive manufacturing to be viable here. It’s not even clear that it would be beneficial. Without the negotiating power of unions to inflate manufacturing wages like in the past, these jobs might not be boon some expect.
More Liquidity Needed?
Along with the supply-side shock of the tariffs, we could be in danger of igniting built-in inflation if the Fed provides too much liquidity in the wake of economic weakness caused by the tariffs. This is what we mean by “monetizing” the tariffs. Powell has been solid in his stance against rate cuts until after we have more data, but some are seeing cracks in his resolve.
At the recent Jackson Hole Economic Symposium, where central bankers, economists, and policy makers discuss highbrow economic issues, along with presentations concerning current conditions, Powell seemed to open the door to rate cuts as soon as September. DA has often been inclined to dismiss the excitement around such interpretations, but it should be noted that Jackson Hole is famous for marking turning points in monetary policy, and it often occurs after vague pronouncements from a Fed Chairman.
With economic data starting to soften in certain areas, rate cuts may be more warranted in the next few months, but this should not be a foregone conclusion. The extraordinary resilience of the U.S. economy in the face of sharp rate hikes from 2022 into early 2023 took many by surprise. We’ve discussed it several times, and DA continues to believe that the reason for this had everything to do with the enormous Federal Reserve balance sheet. Chart 3 below shows how the Fed expanded its balance sheet through buying U.S. Treasuries in massive quantities during the Covid shutdowns.
Chart 3: Fed Balance Sheet

At almost $7 Trillion, the Fed holds around $5 Trillion more in assets than it would have had the Great Financial Crisis (GFC) and Covid had never taken place. This has been a powerful catalyst supporting risk assets for many years now. It also can best be described as the “monetization” of U.S. government debt. We spoke earlier of how stagflation can be precipitated by the monetization of a negative catalyst, such as a supply shock. That’s already happened to a large extent in the Fed’s efforts to keep the economy from slipping into a deflationary spiral from the GFC and Covid. Without these herculean efforts, another Great Depression would have been a likely outcome.
Central bankers use scores of metrics and models to attempt to flesh out where the optimal level for interest rates should be. One of the many policy models used to guide central bankers is a mathematical formula called the Taylor Rule. The formula seeks to tie the amount of excess slack in the economy and the current inflation rates to a specified target policy rate. There are a few different versions, which allows for varying interpretations. In the last year, some economists have expressed the opinion that the Fed Funds rate is too high, but there is no clear consensus on that, with other estimates being in line with current levels.
The Fed’s enormous balance sheet, combined with a stock market sitting at record valuations, does not lend itself to a prescription for more liquidity in the economy. Especially since the current inflation rate near 3% is well above target. Yet, we have a President who seeks to badger the central bank into lowering rates, whether they want to or not.
On top of the persistent attacks on Powell, Trump has now ordered another Fed Governor, Lisa Cooke, to resign, accusing her of mortgage fraud – albeit without presenting evidence. Donald Trump has been convicted of tax fraud to the tune of hundreds of millions of dollars. He has 34 felony convictions , and a civil jury ruling against him for sexual assault. Conservative Judge Clarence Thomas has been proven to have vacationed repeatedly with billionaire Republican donors who had business before the court. And as for the crime he’s alleging Lisa Cooke committed - a major MAGA political ally, Texas AG Ken Paxton, who recently helped Trump gerrymander 5 more congressional Republican seats in Texas - has been credibly charged with the same crime. But don’t hold your breath waiting for Donald Trump to acknowledge any of this. Such attacks are saved exclusively for perceived political enemies.
It would be foolish to think anything other than that the allegations against Lisa Cooke are an attack on the Federal Reserve’s independence. It’s obvious Trump couldn’t care less about mortgage fraud. He has been doing this throughout his second term – abusing his power in every way he can to illicit whatever political end he seeks
Historically, Federal Reserve Independence has been sacrosanct in market circles. History is replete with evidence of hyperinflation and stagflation occurring due to lack of an independent central bank. When politicians have control over interest rates, their preference is almost always for more liquidity, even if the long-term results may be detrimental to the economy.
Presently, markets don’t seem the least bit worried about this potential. In defense of that attitude, it should be noted that the process of getting to stagflation can take some time. U.S. stocks in the early 70s did quite well, powered mostly by a group called the “Nifty 50”. Then in 1973-74, as the economy slipped into an ugly recession, and the SPX collapsed over -50%.
As is typically the case, we must wait for more data. If economic data continues to weaken, then there will likely be a clear case for the Fed to cut rates. But if inflation fails to weaken along with growth, then that may be a sign that the stagflation genie is out of the bottle. The groundwork has been laid. Once that happens, it can be a hell of a problem getting it back in.
The Devil’s Advocate
Disclaimer:
The information provided in this newsletter is for educational and informational purposes only and should not be considered as investment advice, a recommendation, or an offer to buy or sell any securities. The views expressed are based on personal opinions and analysis of market conditions, which are subject to change at any time without notice. Investing involves risk, including the possible loss of principal. Past performance is not indicative of future results. Readers are advised to conduct their own research or consult with a qualified financial advisor before making any investment decisions. The publisher is not responsible for any investment decisions made based on the information provided in this newsletter.