


Arthur Laffer being given the Congressional Medal of Freedom by Donald Trump
In 1974, with the U.S. economy just beginning it’s bout with stagflation, economist Arthur Laffer shared a simple yet influential idea over lunch with Dick Cheney, then the Deputy Chief of Staff for President Gerald Ford. Amid discussions about the nation’s economic malaise—marked by high inflation and stagnating growth - Laffer famously sketched a chart on a cocktail napkin to illustrate his theory that cutting tax rates could, paradoxically, increase government revenue by boosting economic activity. This impromptu drawing, later dubbed the "Laffer Curve," encompassed the essence of supply-side economics and challenged the prevailing Keynesian orthodoxy. It marked the beginning of a radical shift in economic policy thinking, one that would profoundly influence U.S. fiscal strategy in the decades to come.
Supply-side economics emerged in the late 20th century as a response to the economic stagnation and high inflation of the 1970s. Central to its development were economists Arthur Laffer and Robert Mundell, who argued that economic growth could be spurred by incentivizing production (supply) through tax cuts and deregulation. Laffer proposed that there is an optimal tax rate at which government revenue is maximized, and beyond this point, higher taxes discourage work, investment, and innovation, ultimately reducing revenue. Laffer’s ideas gained significant attention in political circles, particularly among conservatives seeking alternatives to Keynesian demand-side economics, which focused on government spending to stimulate consumption.
Robert Mundell, often referred to as the "father of supply-side economics," provided much of the theoretical groundwork for the movement. Mundell argued that monetary and fiscal policies should be used in tandem, with tight monetary control to curb inflation and lower taxes to encourage investment and growth. He believed that high tax rates stifled economic productivity and that cutting taxes would unleash capital, stimulate innovation, and create jobs, ultimately expanding the economy’s productive capacity. Mundell’s insights also extended to international economics, as he emphasized the importance of stable exchange rates and open capital markets in fostering global economic growth.
The fusion of Laffer’s and Mundell’s ideas gained prominence in the United States during the Reagan administration, where supply-side principles were implemented through significant tax cuts and deregulation. While these policies were credited with revitalizing economic growth and reducing inflation, they also sparked debates about rising deficits and income inequality. Critics argued that supply-side economics disproportionately benefited the wealthy and failed to deliver the broad-based growth promised. Nonetheless, the theories of Laffer and Mundell have left a lasting imprint on economic policymaking, shaping debates on taxation, government spending, and growth strategies for decades.
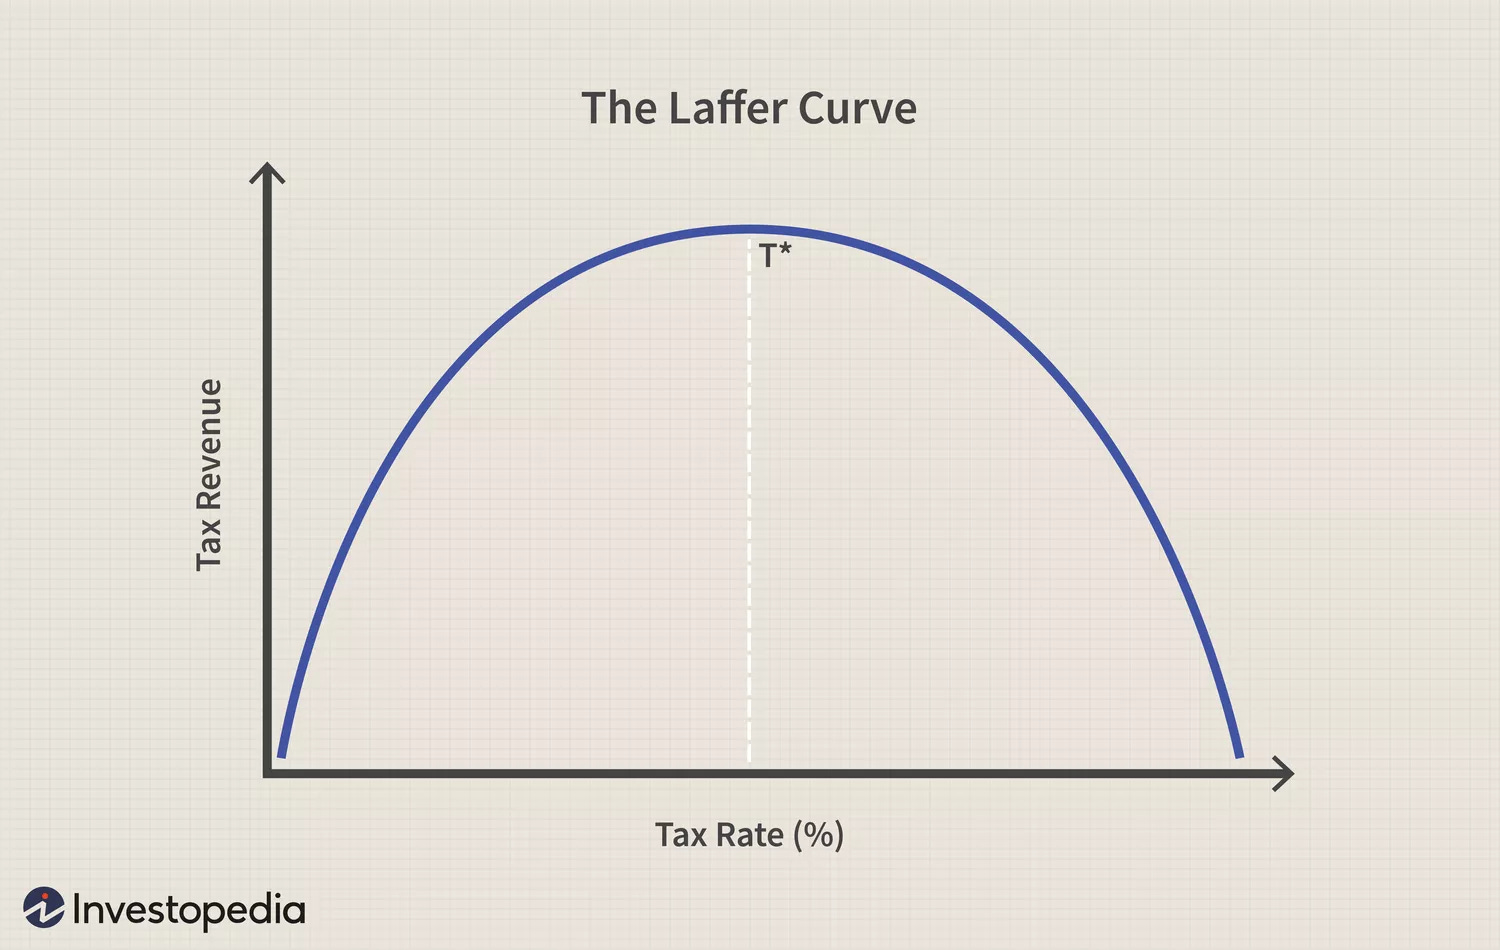
Chart 1 is a simplistic visual representation of the theory with what is called the “Laffer Curve”. T* represents the optimal tax rate. Any lower or higher tax rate than T* will result in less revenue. Therefore, supply-siders want to cut taxes under the assumption that we are already on the right side of the curve. That is, it’s assumed the current tax rate is higher than T*. That may or may not be the case at any given time within the economy. This is “pure theory” in that it simplifies the tax system down to one effective tax rate that applies to the entire economy. In the real world, we have a federal tax code that takes up 70,000+ pages, which determines who you tax at different rates, and how you tax them. The structure of the tax code is at least as important as the effective tax rates.
Chart 1: Laffer Curve
Trend Growth: Same Destination – Different Paths
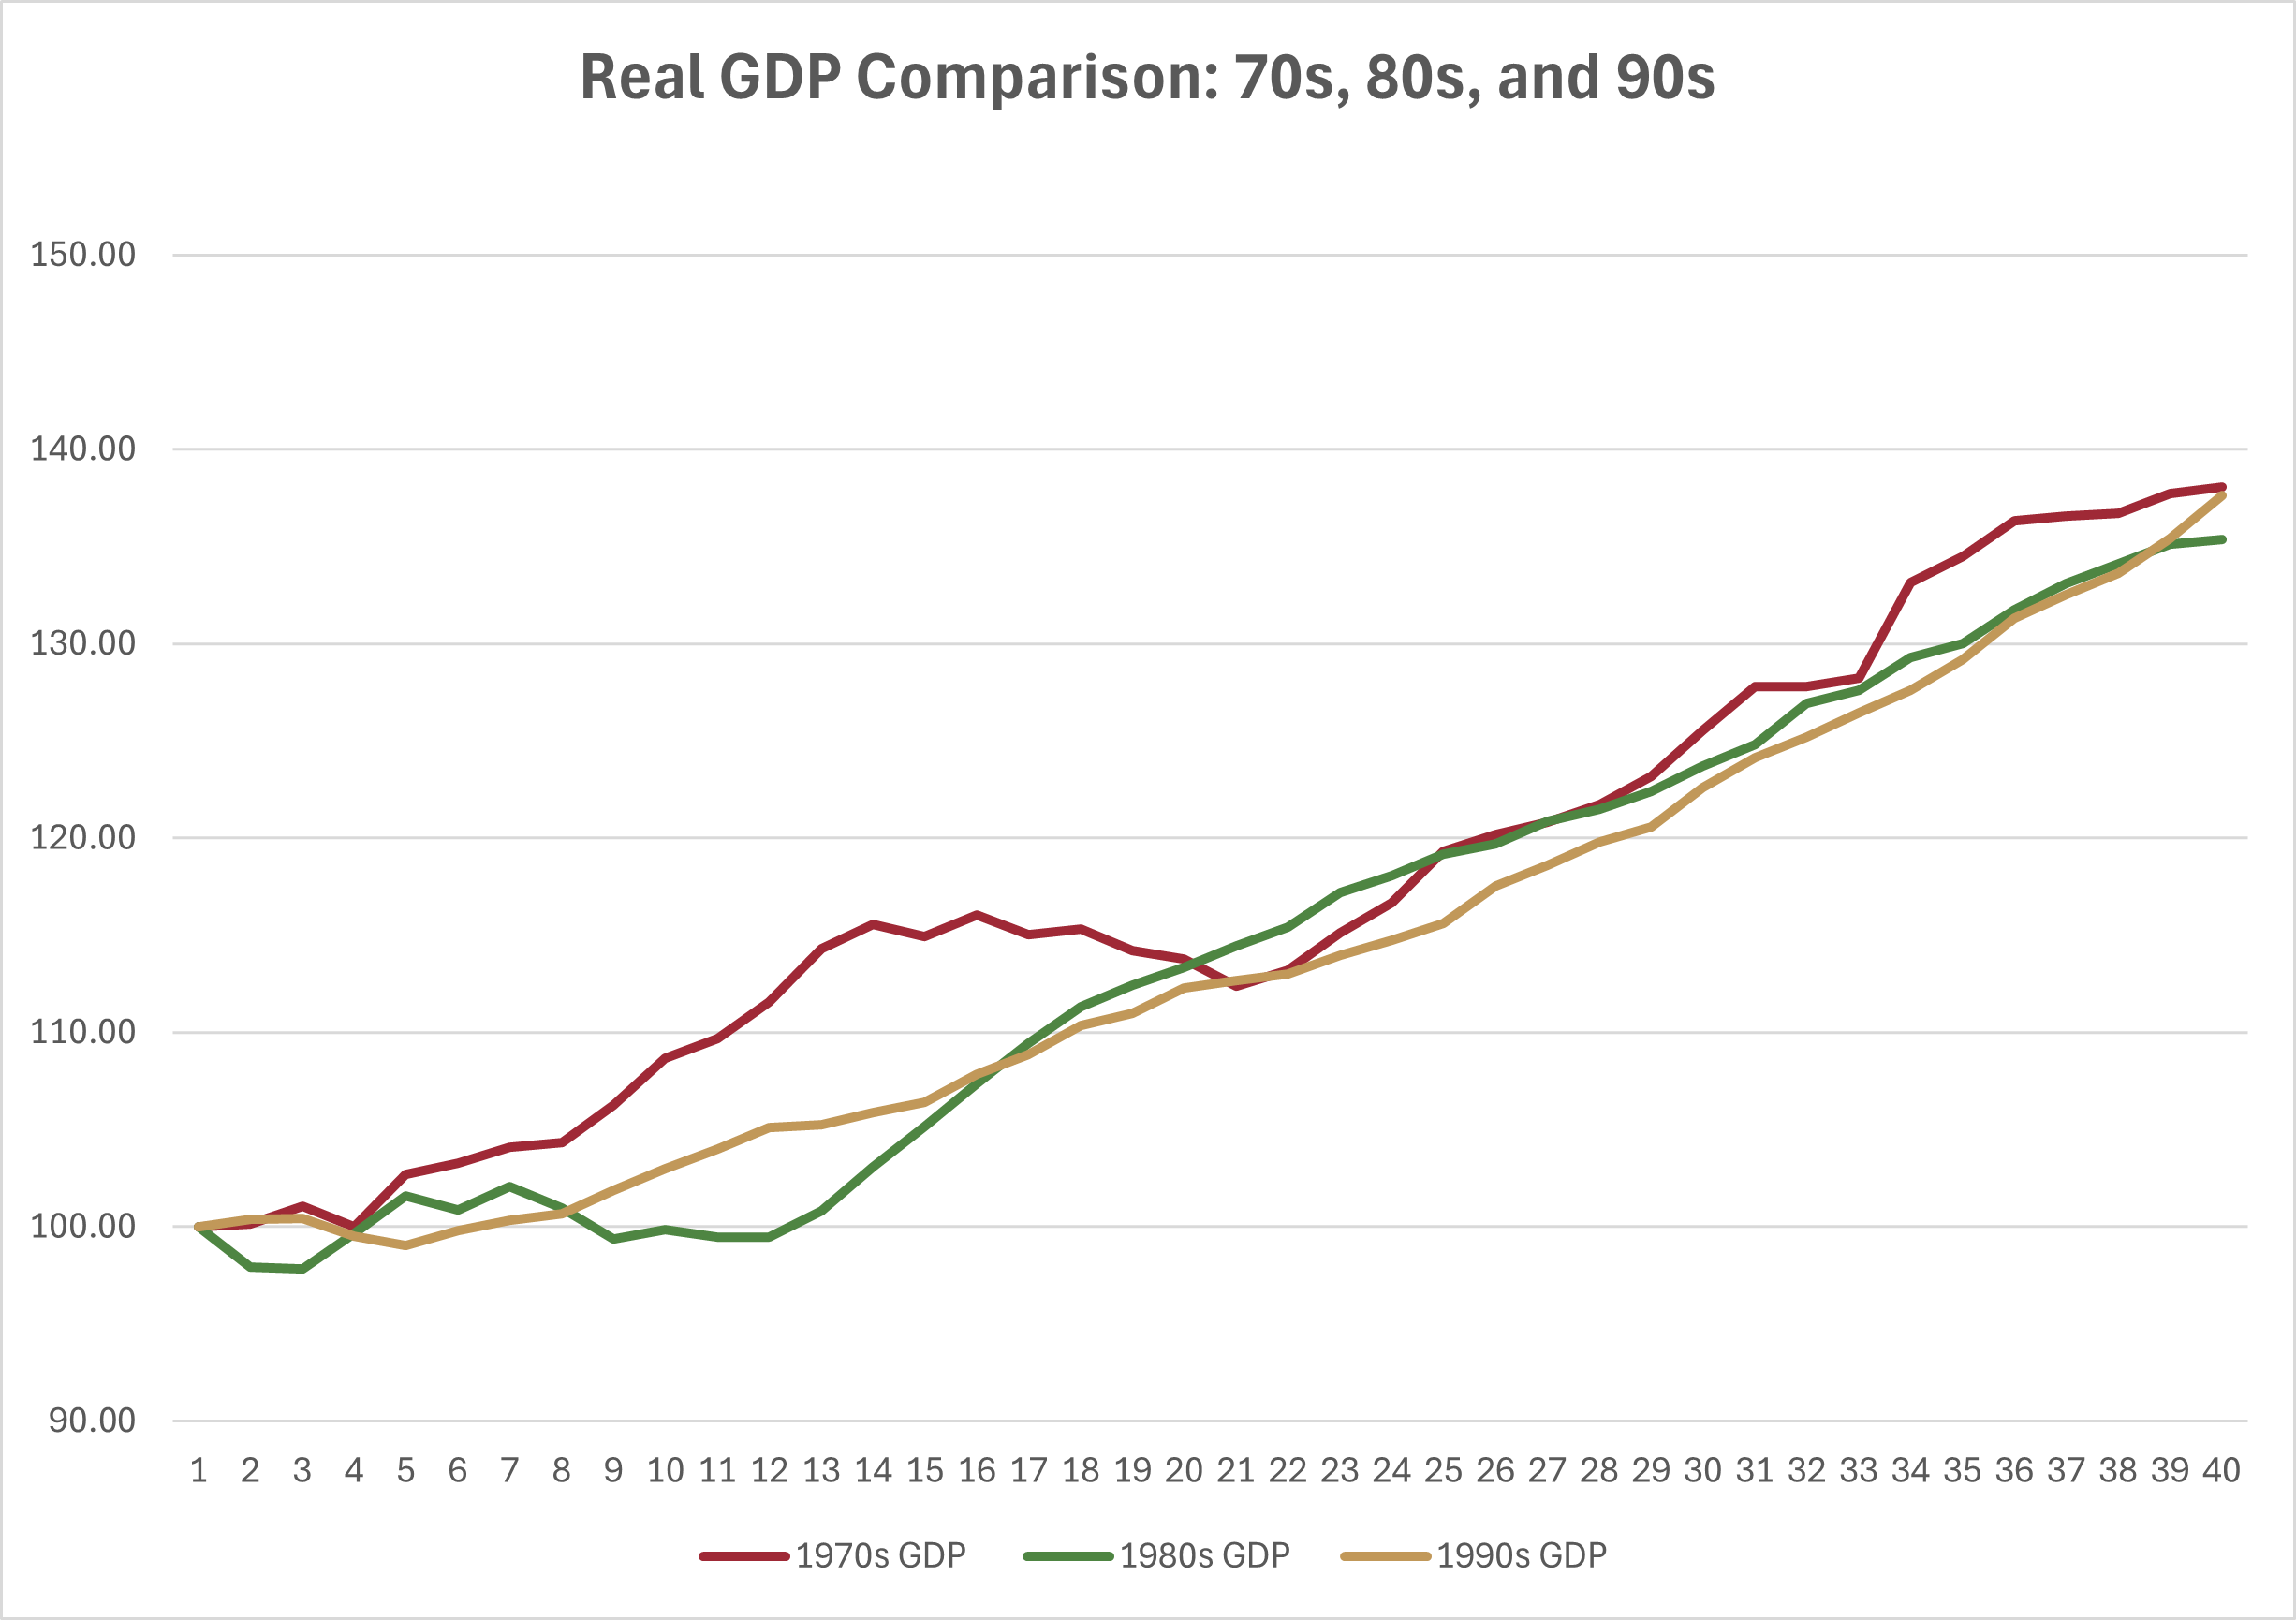
Chart 2 below shows the rise of quarterly real GDP (inflation adjusted) for the decades of the 1970s, 1980s, and 1990s overlayed upon one another. It illustrates what $100 worth of GDP would grow into over each decade. The supply-side debate is centered around how tax policy and government spending (fiscal policy) affect people’s behavior. That is, how can you incentivize people to do things that will boost growth in an economy?
The most interesting result Chart 2 illustrates is the cumulative growth at the end of 40 quarters (10 years) shows little long-term variation. You have 38.1% cumulative growth for the 70s, 35.4% for the 80s, and 37.6% for the 90s. Compound annual growth rates for all the decades ran between 3% and 3.2% per year. This can be considered “trend growth” and is a function of population and productivity growth. Yet each of these decades had a considerably different economic backdrop, with fairly significant differences in policies.
Chart 2: Growth Comparison
Data from Federal Reserve Bank of St. Louis: Real Gross Domestic Product (GDPC1) | FRED | St. Louis Fed
1970s
Regardless of the economic backdrop, there were variations in the path of growth, but not the end result. The 1970s (red line) had blistering growth in the first half of the decade, which was driven by the combination of Vietnam War spending, and the burgeoning social spending from LBJ’s “Great Society”. Economists came to call this the “guns and butter” economy, where both military spending and social welfare are both supported by government deficit spending. It creates inflationary pressures over time, particularly if the country’s central bank isn’t diligent about controlling inflation.
In addition to inflation pressures already prevalent at the time, in 1971, President Nixon removed the U.S. from the Bretton Woods agreement, which required participating countries to peg their currency to the U.S. Dollar (USD), while the U.S. government promised to sell gold at a price of $35/oz. It is generally considered to be a “gold standard”, but it wasn’t really. It was a USD standard with the added benefit of the USD being pegged to gold.
The continued success of the Bretton Woods system hinged on our trading partners being willing to hold USD instead of gold. But by 1971, there were too many dollars floating around the world for a $35/oz price to be sustainable, and some trading partners started to become concerned with how much USD they were holding. Some have criticized Nixon’s decision to break the gold peg, but it doesn’t look as though there was a choice. At $35, the U.S. would have quickly run out of gold, and Bretton Woods would have failed anyway. On the other side, if the U.S. raised interest rates enough to hold gold at $35, it would likely have created a nasty recession.
The result of removing the gold peg was that there were now much fewer constraints on money and credit growth. This set the stage for the 70s stagflation. However, for the first four years of the decade, there was explosive real growth. Not only did the early 70s outpace the other two decades, but it ran at a considerably quicker pace than any time in this thirty-year period. Such a rate of growth was not sustainable, in that it was what is considered “above trend”. Above trend growth will inevitably give way to below trend growth, which is exactly what happened in the middle of the decade. Returning to Chart 2, the red line (70s) goes from rapid growth into the longest downturn of the period. In the second half of the decade, growth reverts to the mean (trend growth).
1980s
The 80s (green line) followed a pattern that was almost mirror image of the 70s. By the beginning of the 80s, inflation had reached double digits, and Paul Volker had been brought in to reduce it by all means. As he jacked interest rates well above 10%, the economy screeched to a halt. This produced one of the only two “double dip recessions” in the last century (the first was 1937-38) and led to well below trend growth. This put the U.S. economy in a hole in the first couple of years of the 80s. But in 1983, things started to bottom out and the U.S. economy rose above trend for most of the rest of the decade. Mean reversion like the 1970s, but from lower to higher growth.
1990s
The 1990s (gold line) growth was the steadiest of the three decades. The U.S. economy was in a mild recession in the first years of the 90s, but quickly returned to trend growth and stayed there for the duration of the decade. Many attribute this steady growth rate to the fall of the former Soviet Union, and the “peace dividend” that came with the subsequent reduction of military spending. Others tout the emergence of the internet, and all the requisite technology to support it. Regardless, there are several factors at hand, but Americans in the 1990s had less economic uncertainty than they had felt in the previous two decades.
A Grand Experiment
The agenda that has been laid out by the incoming Trump administration could wind up being an extreme version of the supply-side revolution of the 80s. However, this may be a REAL test of supply-side economic theory. By that, I mean that the goal of the Trump administration seems to be to deliver large tax cuts while drastically cutting government spending. In the 1980s, there weren’t nearly enough spending cuts to maintain or reduce deficits. Deficits actually exploded higher throughout the decade. In that way, the Reagan Revolution was not a vindication of supply-side economics, even if economic growth accelerated. Of the three decades we covered, the 80’s had the worst growth! Not to say that is definitive. It was by a very small margin, but nonetheless, it doesn’t support the premise of the supply-siders that tax cuts alone spur economic growth.
The closest thing to a true attempt of implementing supply-side theory may have occurred back in 2012 in Kansas. A Republican in Kansas, Sam Brownback , ran for governor while promoting a supply-side agenda. Dubbed the “Kansas Experiment”, it was hailed as a revolutionary idea by conservatives at the time. Unfortunately, the reality did not live up to the hype. After 5 years, the tax and spending cuts were repealed, as the general consensus came to feel the project was a complete and utter failure. One poll found that over 60% of Kansans considered the plan a failure, and only 7% considered it a success.
But politicians never like to admit they were wrong about anything. There are many conservatives who contend that the supply-side premise is still valid, it’s just that Kansas made some mistakes in the design and implementation. If done correctly, and given enough time, we would see more positive results.
“The issue was one of extreme imbalance combined with a poor policy design that exempted all pass-through income from taxation and encouraged tax avoidance activity. Policymakers initially considered a $900 million tax cut offset with a roughly commensurate amount of spending reductions. But because such deep cuts were never particularly feasible—the state’s general fund budget was $6 billion—lawmakers eventually decided to move forward with tax cuts while jettisoning the offsetting reductions, accompanied by some hand-waving about how the difference would be made up through tax cut-induced economic growth.”
As for Trump’s proposed policy , it’s difficult to analyze when the potential numbers could be beyond anything we’ve seen in modern times. There is talk of cutting as much as $6 Trillion, or approximately 20% from the federal budget. Many Trump voters in Dark Red States are likely to be affected severely by cuts in social services. My guess is they will be completely caught off guard.
The expectation is that large tax cuts with large government spending cuts will unleash a river of money that was previously going to government spending flowing into the private sector to invest, driving jobs and income growth. Government bureaucracy tends to gum up the works, and more importantly, is not driven by a profit motive. This means that there is very little incentive to keep government operations running efficiently, which can serve to dampen economic growth.
The economic argument of supply-side economics is mostly sound in the abstract. I’ve always believed that supply-side theory is nothing more than free market economics. Anyone who has taken Econ 101 can tell you that free markets are more efficient, and therefore lead to higher economic growth. The difficult question to answer at what point is more growth not worth the costs? Unfettered free markets will inevitably create some ill effects. We know from experience that there are economic actors who have made large profits while polluting rivers and land, but never had to pay the cost of cleanup. The environment is a public good that belongs to all of us. Many of the regulations may be onerous, unnecessary, or outright detrimental, but most would agree that some regulation is an absolute must. Finding the right balance is a trial-and-error process.
In addition to environmental regulation, laws to protect consumers from fraudulent business practices, and dangerous or faulty products, are something most Americans agree is a necessity. Even with such laws, consumers must constantly be on guard, because once you’ve been exploited by a scammer, you may not have the ability to get your money back. Just like with environmental regulation, consumer protection involves an ongoing effort to find an optimal balance between shielding consumers and promoting growth.
Putting it All Together
One of the primary points I’ve endeavored to make comes from the GDP comparison analysis above. I find it fascinating, and quite illustrative that no matter what economic events are occurring, or policies in force from 1970-2000, the economy tended to grow around 3%. Despite all the handwringing, and arguments over policy, trend growth did not change over the long haul. At the very highest level, trend growth is driven by growth in population, and growth in productivity. Most economic policies don’t have much permanent effect on these things. Population growth depends on the demographics inherent in the country, and productivity growth is mostly dependent on technological advancement. Policies can push these things in either a positive or negative way, but rarely have substantial long-term effects.
Of course, the point must be made that not all growth is created equal. The 70s growth was driven more by high oil prices and commodities which drove higher inflation. Growth of this type did not benefit most Americans. The 80s saw falling inflation, and a huge resurgence in asset prices, as interest rates began a long-term structural downtrend. The 90s growth was influenced by the development of the internet, large technological advances, and the efficiencies these brought about.
The differing sentiment during each period is much easier to understand when you consider that economic uncertainty is the primary input. Chart 3 below paints the picture. The 70s had a severe recession in the middle of the decade with recessions at the beginning and the end. The 80s had a double dip recession early on, but then managed to avoid negative growth for the rest of the decade. The 90s had a mild recession early, and never looked back. So, if you rank each decade by the level of uncertainty, the 90s were the best, and the 70s were the worst.
Chart 3: U.S. GDP – Recessions in Grey

A few points about the 90s that need mentioning. The Clinton tax cuts enacted in 1993 sought to lower taxes on the middle class, while raising them for wealthier Americans. At the time, this was criticized by Republicans as reversing the policies that led to fantastic growth in the 1980s. But that was not the case. It should also be mentioned that Republicans took back the House of Representatives in 1994 for the first time in several decades, and proceeded to push strongly for spending cuts, succeeding in implementing one of the biggest budget cuts in U.S. history. Along with the strong and persistent economic growth from the tech boom, this budget discipline helped set the stage for budget surpluses at the end of the millennium. This is a strong argument for the superiority of bipartisan dealmaking, and divided government in general. It keeps the excesses of each party in check.
Unfortunately, that’s not what we have now. Markets have been following the “Trump Trade” since the election. In a nutshell, markets have moved sharply higher on the basis of an expectation of much more business friendly policies. Personally, I would consider a rather typical knee-jerk reaction. Despite evidence to the contrary, many believe that Republicans are always better for markets. Not to say there is no basis for optimism, just that it requires a very glass half full view of the future.
Whether it’s economic growth, or stock market returns we’re talking about, there are dozens of factors that determine the outcome. Sometimes there are dramatic shifts in technology, demographics, or extreme shifts in economic and market sentiment. Sometimes the economy has been growing by leaps and bounds, but the momentum is driven by a sharp expansion of credit and leverage in the economy (market bubble), which will be reversed in the future, bringing growth back to trend. Other times, a long-term build up of credit and leverage implodes due to excesses that built up over many years (e.g. Great Financial Crisis or Great Depression).
But I think the least understood element is the initial conditions at the beginning of a presidency. Presidents do not manage economies – economies manage Presidents. What I mean by this is that the tendency to crediting or blame U.S. Presidents for everything that happens in the economy while they hold the office is not supported by facts or logic. Not only must economic policy pass through Congress, but most changes in U.S. policy do not entail a large enough deviation from the average to cause permanent shifts in growth. Absent a very substantial shift in economic structure and/or policy, or a major economic shock (energy crisis, World War, etc.), economic growth may oscillate but will tend to return to trend.
That said, depending on how aggressive the Trump administration is, or the sequence in which different policies are enacted, the initial outcome could be decidedly positive, or negative. For instance, if tax cuts occur at the beginning, before implementation of tariffs or spending cuts, then there is likely to be a boom scenario. However, this would eventually lead to a bust. On the other hand, if Trump immediately implements tariffs before positive offsets, then things will get ugly quickly. Given the erratic nature of Donald Trump, and the extreme nature of American politics right now, we will just have to wait and see, but I don’t think we’ll have to wait long.