
Why So Gloomy Goldman?


Over the last week, market professionals have been posting and commenting on the most recent market forecast put out by Goldman Sachs. This is par for the course - all the biggest investment banks update their forecasts at least once a quarter, and the more prestige the bank has, the more it will be discussed. What makes this one special is that Goldman’s Global Equity Strategist, David Kostin, had the unmitigated gall to forecast that with current market valuations and conditions, the 10yr compound return for the SPX over the next decade would be about 3%. That is decidedly on the low side of history.
Standard investment bank forecasts generally hug the average, with a bias toward the better historical outcomes. It’s an open secret on Wall Street. Why? It’s pretty simple really. Positivity sells, and negativity doesn’t. Try getting clients to invest with you if you tell them the next 10 years will see equities returning a lot less than historically. Try telling them that if they’re within 10 years of retirement, they had better start cutting back, and adding more to their savings, because it won’t be growing as fast. It’s human nature really.
The curious thing is that when you look at Chart 1 below, there is a fundamental historical basis for such a forecast. This chart is taken from the aforementioned Goldman report. The dark blue line is the realized trailing 10yr compound return for the SPX, while the light blue line is the return that their forecasting model would have predicted looking back ten years. The most apparent observation is that the two previous peaks in 10yr returns happened around 1960 and 2000, and between the tops, there were periods of paltry, and sometimes negative, returns. But at market highs, it’s anathema to investors, individuals and professionals alike, to acknowledge the possibility of weak returns.
Goldman’s 3% CAGR in this forecast represents their baseline forecast. The real forecast is a range based on probabilities, similar to the “Cone of Uncertainty” weather forecasters show when they are illustrating possible paths a hurricane might take (Chart 2). The two standard deviation range is plus or minus 4%, which is huge when you’re talking about compound return over a decade. On the low end of the range, you have -1%, which over ten years turns a $1000 investment into $904. Quite depressing! At the high end, your $1000 is compounded at 7%, which would turn it into $1967. These extreme outcomes, and all the outcomes in between represent 95% of the predicted rates of return. Smack dab in the middle of that you get 3% compounded, which after ten years becomes $1343.
Chart 1: Goldman Sachs Forecasted 10yr SPX Trailing Returns
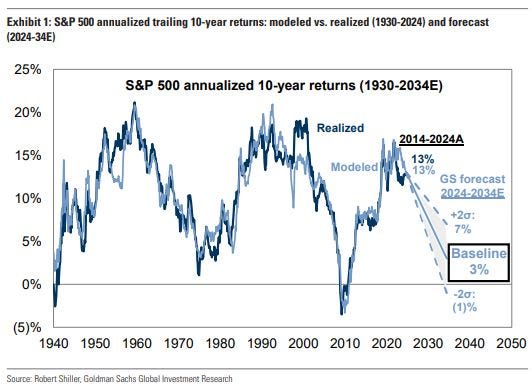
Chart 2: A Hurricane’s Cone of Uncertainty

Goldman’s Model
Ask 20 different market strategists to provide their models for predicting equity returns and you’ll wind up 100+ different indicators. Many of these will be similar to each other, or modified versions of the same indicators, but the diversity of approaches will be readily apparent. Many strategists will create multiple models, choose the one they believe to be most accurate, or build a forecast blending several models together. It would be onerous to try to cover all possible inputs, but it is worthwhile to study the components of the Goldman model in this case.
List of Goldman Indicators with a basic rationale
1. Starting Absolute Valuation: Forward rates of return are strongly negatively correlated to starting valuations. Expensive stocks underperform over time. Expensive markets tend to underperform as well.
2. Stock Market Concentration: ???– Not so straightforward. We’ll return to this.
3. Economic Contraction Frequency: Probability of recession is self-explanatory, as it hurts earnings.
4. Corporate Profitability: While this is somewhat covered under “Absolute Valuation” expected growth of earnings still must be addressed.
5. Interest Rates: Partly a function of overall liquidity in the marketplace, and the input used to estimate the present value of assets by discounting expected future earnings.
Four of the five indicators are easily explained given a basic understanding of markets, and economics. On the other hand, market concentration is a little harder to explain. In Kostin’s own words:
“Our forecast would be 4 pp greater than our baseline if we exclude a variable for market concentration that currently ranks near the highest level in 100 years. The 7% return would rank in the 22nd historical percentile.
The intuition for why concentration matters for long-term returns relates to growth in addition to valuation. Our historical analyses show that it is extremely difficult for any firm to maintain high levels of sales growth and profit margins over sustained periods of time. The same issue plagues a highly concentrated index. Furthermore, the risk embedded in high concentration markets is not always reflected in valuation.”
So effectively, what Kostin is saying is that without this one indicator, market concentration, their baseline forecast would be 4 percentage points higher! Even though that’s only in the 22nd percentile of all results from 1930, it would still manage to almost double your money. Not great, but not horrible.
The rationale here is that when extraordinary concentration exists, too much of the earnings growth comes from too few participants. The situation usually arises during bull markets, as one or two sectors dominates growth, and generates most of the exuberance for investors. In the past few years, we’ve seen the birth of “The Magnificent Seven”, seven companies that have come to encompass over 1/3 of the entire SPX market cap
Small companies can grow at very rapid rates for decades without limitations other than sector competition, and the total size of their product market. However, mega caps, which are generally defined as companies valued at over $200 billion., have great difficulty growing quickly for long periods of time. There just aren’t enough new business areas to move into that will generate outsized earnings growth. Since they represent such a large portion of the SPX, their size will tend to weigh on earnings growth for the index going forward. For investors indexing their investment portfolios, this can present a problem.
Chart 3 below shows the history of market concentration going back to the beginning of the U.S. stock market using total U.S. market cap (vs. SPX market cap above). Presently, we’ve only been this concentrated a few times in the last 200 years. Certainly, an extraordinary situation.
Chart 3: Equity Market Concentration in the United States

From Global Financial Data May 2024: 200 Years of Market Concentration - Global Financial Data
It’s not surprising that many investors found the Goldman forecast to be shocking, since the majority are always most bullish at record highs. That alone is not a reason for a bearish earnings forecast, but from a positioning standpoint, it is a reason for caution. As we covered last week, Americans have never had a higher proportion of their money invested in stocks. With only 7 stocks composing around 35% of the most important large cap index, the implication is they’ve never had more exposure to such a small number of companies. At least, not since the 1960s. From a diversification perspective alone, this should be considered a risk. Especially in concert with high valuations.
Ultimately, there will be a decade-long period where the SPX will only return low single digits, or even negative compound returns. History doesn’t repeat, but it absolutely rhymes. Psychologically, investors are never prepared for these periods, because they can’t believe it will happen. Most people are virtually helpless against recency bias. That is, people’s most recent experience dominates their visions of the future. Our expectations are usually just an extrapolation of the recent past.
Returning to Chart 1, if you look at the 1990s, there was a peak in realized 10yr returns early in the decade. Then it plateaued before spiking higher due to the late ‘90s tech bubble. I find this very interesting, because throughout the period covered by the model, this is the one time where you see the dark blue line (realized 10yr returns) separate from the light blue line (model predicted returns). Bubble dynamics completely explains this outcome. If the model is giving a reasonable forecast based on market fundamentals, then it must have been a break from fundamentals (a bubble) that brought this about. Where I’m going with this line of thought is that any substantial deviation from the model prediction over the next few years is likely to happen under the same circumstances
In the meantime, the Goldman report has one major call to make. That is, an Equal- Weighted SPX portfolio should outperform the standard Market-Weighted Index over the next 10 years. This makes perfect sense. Chart 4 below shows the ratio of the Equal-Weighted SPX ETF (RSP) vs. the standard ETF (SPY). In July of this year, it reached a 20 year low. Regardless of the earnings generated or price action over the next 10 years, an Equal-Weighted SPX should outperform the SPX.
Chart 4: Equal-Weighted SPX ETF (RSP) Ratio to Market-Cap-Weighted ETF (SPY)

Excitement about Artificial Intelligence (AI) is the largest force driving the market right now, particularly the top mega cap stocks. With the ample central bank liquidity we’ve spoken of in recent pieces https://atkinsonr.substack.com/p/to-have-your-cake-and-eat-it-too?r=40eyx3, and the exuberant expectations surrounding AI, it doesn’t take a leap of imagination to see a similar occurrence taking place in the next few years. If that is the case, the inevitable cyclical downturn will still occur but will likely be pushed out another 3 to 5 years. There’s a ton of uncertainty in the global economy and markets right now. The upcoming U.S. presidential election has an unusually large range of risks. Until we have a clearer vision of the policy framework over the next few years, it’s unwise to make hard calls about the market. If nothing else though, investors would do well to be cautious here. Markets are heavily overbought, investors are heavily concentrated in equities, and event risk is enormous. Hopefully, in a few weeks there will be more clarity.