


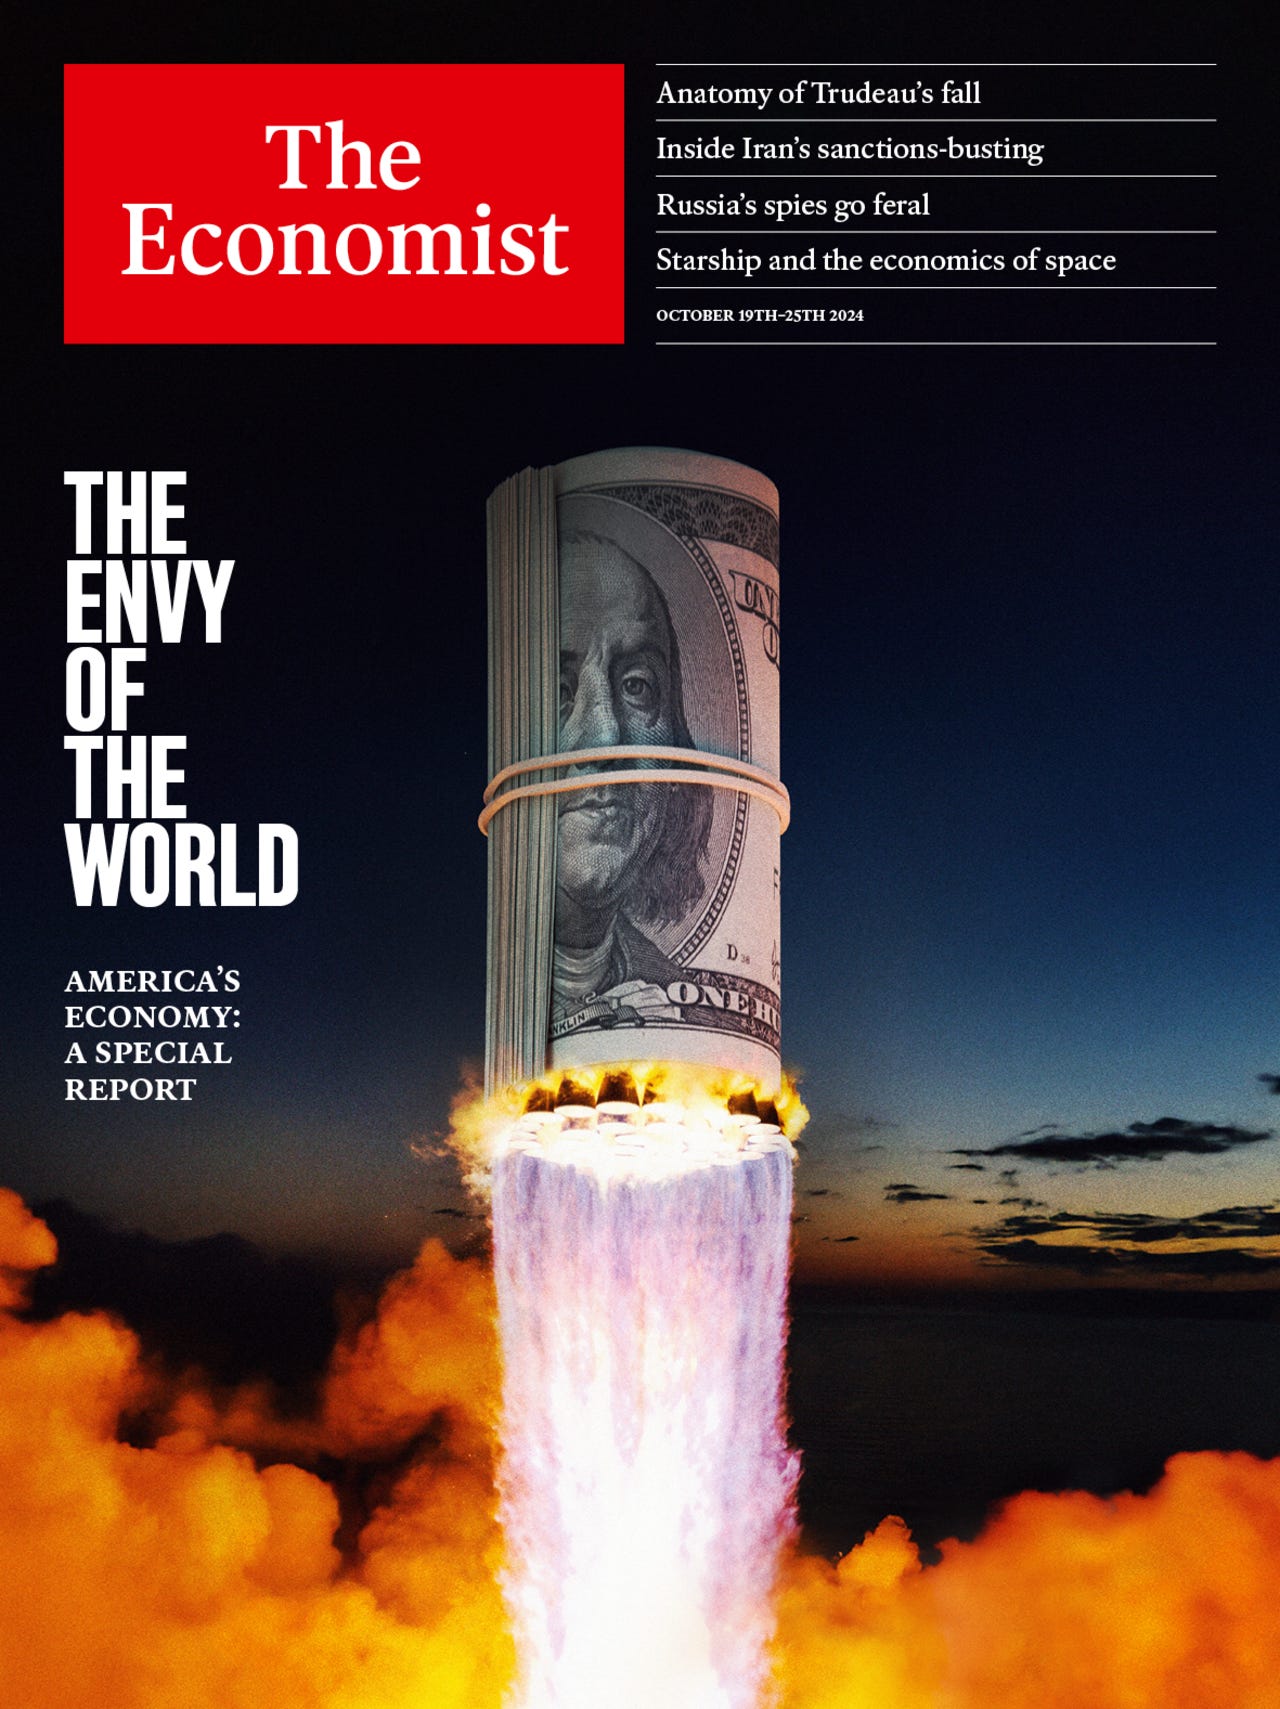
The Magazine Cover Indicator
Above is a recent cover of the Economist magazine proclaiming the U.S. economy the “Envy of the World”. Such covers are often seen as a flashing red signal for the object of praise, whatever it may be. “The Magazine Indicator”, as it’s called, is well known in investing circles, and is probably the most recognizable contrarian indicator that exists. The premise may not have scientific backing, but anecdotally, it seems to have a solid foundation. It has its roots in some infamous bad market calls: for instance, BusinessWeek’s “The Death of Equities” cover in 1979, which was amazingly close to the start of a two decade-long bull market. Or Time magazine putting Jeff Bezos on the cover right before Amazon’s stock collapsed during the dotcom bust. Of course, like most indicators, it has its share of failures. In 2008, a number of magazines predicted that the housing market would continue crashing, and that turned out to be spot on. One study concluded that it works about 68% of the time, which is much better than many signals, albeit somewhat subjective.
Magazine editors do an excellent job of aggregating the sentiment of large groups of people. If you want to sell magazines (or these days, get clicks), you do it by writing about the things most top of mind with the largest amount of people. So, when a widely read magazine highlights a financial trend on the cover of a magazine, you can be sure that the market is already tuned in to the fundamentals behind that trend, and it is mostly priced into the market. Put another way, if the story is mega bullish, you can bet most investors already own it.
American Dominance
It never goes out of fashion to proclaim the United States as the “Greatest Country in the World”. Well - at least within the U.S. 😊 We have been the most economically powerful country in the world for the last century, we have the strongest military, the world’s reserve currency, and the entire free world looks to us for leadership. In addition, the last decade or so, our stock market has trounced the rest of the world (ROW).
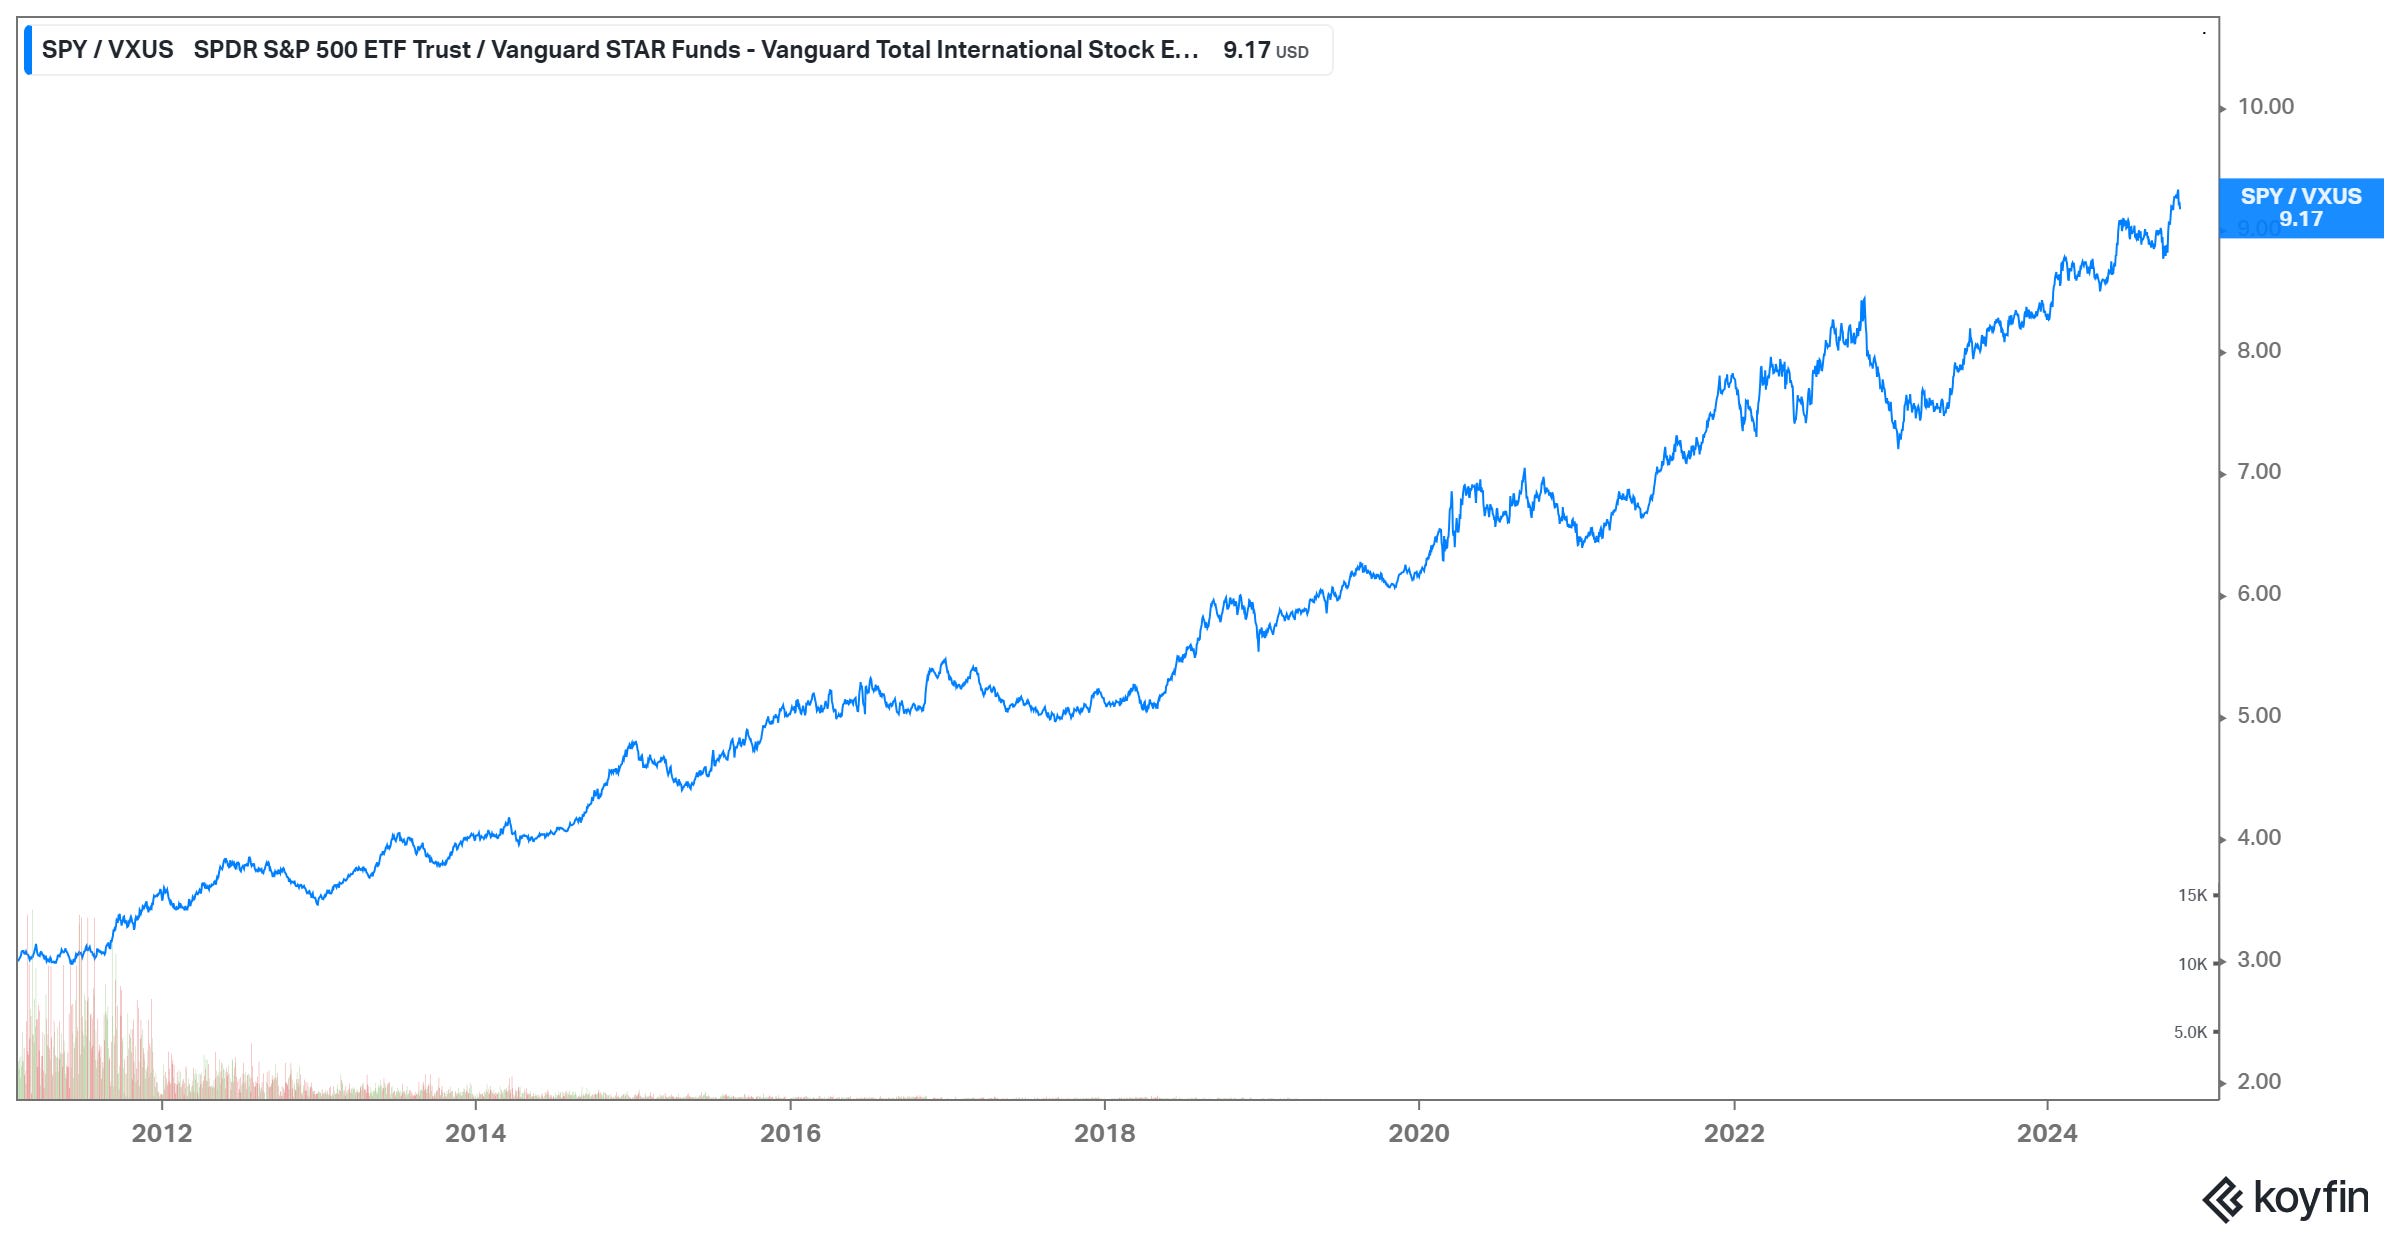
However, we’re not just talking about magazine covers here. In markets, it’s money flows that ultimately matter. Chart 1 below shows the ratio of SPY (S & P 500 ETF) to VXUS (Vanguard International Equity ex U.S. ETF). It highlights the extraordinary outperformance of the U.S. equity market versus the ROW. This upward trend is about as beautiful as you’ll ever see in any market. It has been incredibly persistent, substantial, and at this point, doesn’t look to be stopping anytime soon.
U.S. stocks have outperformed global counterparts over the past decade due to several key factors. First, the U.S. has a unique concentration of large, innovative tech companies like Apple, Microsoft, and Alphabet (Magnificent 7), which have experienced explosive growth and driven market returns—these companies now represent a significant share (around 35%) of the SPX. Second, the Federal Reserve’s monetary policies, particularly low interest rates, and quantitative easing, have supported asset prices by making borrowing cheaper and boosting liquidity in financial markets, which provided rocket fuel for stock price growth. Finally, the U.S. enjoys a stable political and regulatory framework (for now at least) that attracts both domestic and foreign investors seeking growth with relatively lower geopolitical risks, compared to emerging markets or regions facing geopolitical risk. This combination of tech dominance, ultraloose monetary policy, and relative stability has kept U.S. equities on top for most of the past decade.
Chart 1: S & P 500 vs. ROW ETF Ratio
Part of a Bigger Cycle
Ten years seems like a long time, but sometimes, we must look over much longer periods to see the real picture. Chart 2 shows the outperformance, or underperformance, of the U.S. market vs. ROW (blue) since 1975. These past 40 years, the chart shows 3 full cycles of U.S. stocks underperforming, and then outperforming the ROW. Chart 2 also includes the DXY (U.S. dollar index in grey), which not coincidentally shows that the U.S. dollar tends to positively correlate with U.S. equity outperformance.
The simplest explanation for this correlation is money flows. If international investors are investing in the U.S., they must buy U.S. dollars first, thereby driving it up. As well, a stronger dollar boosts the appeal of U.S. assets, as foreign investors perceive lower currency risk when investing in dollar-denominated securities. When the dollar strengthens, returns on foreign investments may decline when converted back to local currencies, making U.S. equities more attractive by comparison. Additionally, a robust dollar often reflects favorable conditions in the U.S. economy, such as stable growth and rising productivity, which support corporate earnings and investor confidence in U.S. companies.
This relationship is particularly relevant for companies with less international revenue exposure (smaller cap stocks), as a stronger dollar can hurt earnings when foreign sales are converted back into dollars. Consequently, a rising DXY often correlates with stronger demand for U.S. stocks, especially in sectors like technology and financials, which have been resilient during periods of dollar strength.
Chart 2: US Equity vs. International Equity 5yr Monthly Rolling Returns (Blue) with Dollar Index (Grey)

Shifting Winds
But all good things must come to an end. Currently, the outperformance trend of the U.S. has lasted for about thirteen and a half years, which is longer than recent cycles. At some point, equity valuation differentials reach extreme levels that can no longer be justified by growth differentials. Determining when the valuation differential between U.S. and non-U.S. equities has become excessive requires assessing several indicators. It’s always easiest to compare price-to-earnings (P/E) ratio of U.S. stocks relative to global or regional benchmarks. Presently, Chart 3 shows the P/E ratio of the U.S. market is at a 70% premium to global markets (blue line). If U.S. earnings growth prospects aren’t sufficiently stronger relative to the ROW to justify the premium - and that is a tall order at these levels - then this premium cannot last.
On a broader basis, macroeconomic factors can also highlight overvaluation. For example, if global growth prospects improve or the U.S. dollar weakens, international equities tend to benefit from investment inflows, especially in emerging markets where valuations may be lower. A declining dollar increases the value of foreign earnings when converted back to U.S. dollars, often boosting the appeal of international stocks for U.S. investors. Additionally, when global central banks implement more relatively accommodative monetary policies, especially in high-growth regions, that can provide a catalyst for non-U.S. equities to catch up. Monitoring these signals—valuation ratios, growth forecasts, and currency trends—can help identify when the U.S. value premium may be overextended and when a reallocation to international markets could offer better returns.
Chart 3: U.S. Stocks P/E to Global Stocks P/E Ratio with DXY

Chart 3 above shows the U.S. Equity PE to Global Equity PE Ratio(blue), along with the DXY (red). While the correlation isn’t perfect, for the most part the U.S. dollar appreciates when the U.S. is trading at an increasing premium valuation, which is indicative of money flowing into the U.S. Within the last decade, there have been a few decoupling periods, but the correlation is generally positive.
If we isolate the dynamics of the DXY and valuation differentials – that is, ignore other factors affecting money flows – we can assume that the last leg higher in the valuation ratio (and the index itself) has been driven more by domestic investors rather than foreign investors, since the DXY moved lower during this period. Certainly, the U.S. dollar could trade back to the highs, but it’s less likely to be driven by foreigners investing in U.S. stocks at this point in the cycle.
The U.S. Dollar usually appreciates during periods of market turmoil. Most global markets have been on a tear this year, and it wouldn’t be a surprise to see a substantial pullback, which would tend to push the dollar higher amid safe haven flows.
Tonight’s election could be a catalyst for a move either way, but it seems highly likely it will drag out beyond the evening, and possibly for a week or more. Conventional wisdom has it that a Trump win will be bullish (big tax cuts), and a Harris win bearish. There is no empirical basis for that, since in recent decades the market has done better under Democratic presidents. But more importantly, actual policies may not be what is expected. I would argue that economic policy uncertainty is much larger than in the last few decades.
In conclusion, despite what happens the rest of this year, it is quite likely that the next 5 - 10 years will see foreign stock markets outperformance vs. the U.S. stock market. The dollar is a more complicated matter but will likely trade down as it enters a new cycle. There are a host of reasons why that will be the case, which I look forward to covering in the next post.
Disclaimer:
The information provided in this newsletter is for educational and informational purposes only and should not be considered as investment advice, a recommendation, or an offer to buy or sell any securities. The views expressed are based on personal opinions and analysis of market conditions, which are subject to change at any time without notice. Investing involves risk, including the possible loss of principal. Past performance is not indicative of future results. Readers are advised to conduct their own research or consult with a qualified financial advisor before making any investment decisions. The publisher is not responsible for any investment decisions made based on the information provided in this newsletter.